The Myth Of “Simple Sensor” Accuracy: Why Your Readings Lie

Sensor Drift And Environmental Noise
You want to believe a thermometer stays accurate once you calibrate it. That belief costs you data. Sensor drift is the slow creep of error over time, and it happens to every semiconductor temperature sensor the moment you power it on. Thermal cycling, component aging, and voltage fluctuations all move the goalposts. Your DS18B20 or DHT22 doesn’t stay true. It wanders.
Environmental noise compounds the problem. Electromagnetic interference from nearby power supplies, WiFi transmitters, and even LED displays corrupts the signal your sensor reads. The wires carrying data pick up stray voltage like an antenna. Most DIY builds ignore shielding entirely, then wonder why readings jump three degrees for no reason. You need to acknowledge the sensor lies, then engineer around it.
Heat Transfer Physics Kills Your Assumptions
Physics teaches heat transfer through three mechanisms: conduction, convection, and radiation. Your thermometer measures one thing: the temperature of its own silicon die. It does not measure the temperature of the air, water, or object you think you’re testing. This distinction matters because most DIY builders fail to account for thermal lag and contact resistance. The sensor responds to its immediate environment, not the target environment.
If you mount a sensor in still air, convection barely happens. The air around the probe warms, but fresher air doesn’t replace it fast enough. The reading stabilizes at a false equilibrium. You need forced air circulation, proper immersion depth, or direct contact with known thermal mass to get honest data. Mounting the sensor in a metal sleeve with thermal paste, then waiting for equilibrium, is mandatory. Skip this step and your thermometer reads fiction.
The “Precision Protocol” For Digital Thermometer Builds

Matching The Sensor To Your Actual Environment
You want this to work the first time so you don’t feel stupid admitting the build failed. The mechanism is simple: different sensors have different operating ranges and response speeds, and picking the wrong one guarantees dead-end troubleshooting. Think of sensor selection like signal processing in electrical engineering—you’re matching the sensor’s bandwidth to your measurement task, not just buying whatever’s cheap.
The thermistor dominates DIY builds because it’s affordable and direct: resistance changes with temperature. But thermistors drift over time and hate temperature swings. If you’re measuring stable room conditions, that works. If you’re tracking something that fluctuates rapidly—like a fermentation vessel or an oven—a thermistor will lag behind reality by seconds. The DHT22 sensor adds humidity and responds faster than basic thermistors, but it fails in humidity extremes. DS18B20 sensors use digital output and tolerate wider ranges without recalibration drift. Pick based on your actual range and speed requirement, not aesthetics.
Calibration Methods That Actually Stick
Most guides tell you to dunk your sensor in ice water and boiling water, record the values, and call it done. That’s incomplete. You need a reference standard that exists independently of your build, a control point outside your thermometer ecosystem.
- Two Point Calibration: Use ice water at 0°C and boiling water at 100°C as anchors. This establishes your thermometer’s offset and slope but assumes linear response, which degrades at temperature extremes.
- Reference Thermometer Cross Check: Run your DIY build alongside a calibrated analog thermometer for 24 hours across your actual temperature range. Log both simultaneously to catch drift and hysteresis effects.
- Salt Point Calibration: Use saturated salt solutions at known temperatures (like 4.76°C for ice-salt mix) to add a third reference point. This reveals nonlinearity your two-point method would hide.
- Post Calibration Logging: Record calibration data with timestamps. Sensors drift over weeks and months. Recalibrate every 30 to 90 days depending on the sensor type and operating conditions.
- Firmware Compensation Curves: Build a lookup table or polynomial fit into your microcontroller code based on calibration data. This corrects for sensor drift and nonlinearity in software rather than pretending perfect hardware exists.
The real lever is treating calibration as an ongoing process, not a one time event. Most DIY builders calibrate once, assume perfection, then wonder why their readings diverge from reality three months later. Store your calibration values somewhere you can access them—hardcoded constants, EEPROM on the microcontroller, or a configuration file. When you notice drift, you don’t rebuild from scratch; you update the correction factor and move forward.
Beyond The Arduino Digital Thermometer: Advanced Microcontroller Integration
When Interrupts Replace Polling
You want to feel like you’re doing real engineering work instead of watching your microcontroller waste cycles asking the same question over and over. The mechanism is simple: interrupt-driven acquisition replaces polling, which means your sensor doesn’t get checked on a fixed schedule. Instead, the microcontroller waits in a low-power state until the sensor signals that new data exists, then captures it immediately.

This shift matters because polling drains resources and introduces latency jitter. With a thermistor or DS18B20 temperature sensor, you set up an external interrupt or timer interrupt that triggers only when measurement conditions change. The microcontroller executes your temperature-reading routine on demand, not every millisecond regardless of whether anything happened. Your code stops burning power for nothing.
Dropping Power Draw Below The Noise Floor
Most guides tell you to add a sleep mode and call it optimization. That’s incomplete. Real power reduction comes from understanding that your microcontroller has multiple sleep states, each cutting different subsystems. Deep sleep modes shut down oscillators and RAM retention. Light sleep modes keep certain peripherals alive. The trick is matching your sensor’s wake behavior to your controller’s sleep capability.
If your thermometer runs on battery, you need the microcontroller to sleep with the sensor polling interval built into the wake timer. When the timer fires, the CPU wakes, reads one temperature value through the I2C or one-wire interface, stores it, then sleeps again. This protocol reduces average current draw from milliamps to microamps. Set your wake interval at exactly the refresh rate your application demands, not faster.
Infrared Thermometer For Electronics: A Deeper Dive Into Non Contact Measurement

Why Emissivity Actually Matters
You want an infrared thermometer because you think it measures temperature accurately without touching anything. It doesn’t. The real problem is emissivity, and most people skip it entirely because understanding it requires admitting their readings are wrong. Emissivity is the ratio of infrared energy an object emits compared to a theoretical perfect emitter at the same temperature. Every material has a different emissivity value between 0 and 1. A black surface emits more infrared than a shiny metal one at identical temperatures.

Your DIY infrared thermometer assumes an emissivity of 0.95 by default, which works fine on matte black PCB traces but fails catastrophically on solder joints, capacitor leads, and IC legs. Shiny metals sit around 0.1 to 0.3 emissivity. This means an infrared sensor pointed at a polished aluminum heatsink will read 20 to 40 degrees Celsius lower than actual. You either adjust the emissivity setting on your sensor firmware or tape the surface with electrical tape to standardize it. Most people do neither, then wonder why their measurements don’t match reality.
Spotting Hot Spots Before They Kill Your Circuit
Thermal imaging borrows from military targeting systems that map temperature gradients across space. Your DIY digital thermometer becomes a basic thermal imager when you understand that a single-point sensor reveals nothing about spatial heat distribution. The mechanism that matters is gradient mapping: move your sensor across a component in a grid pattern, recording coordinates and temperatures, then plot them to find where heat actually concentrates.
Hotspots on a PCB typically cluster around voltage regulators, power transistors, and current traces carrying high amperage. An unmodified infrared thermometer sensor, when moved systematically across these areas at consistent distance, exposes thermal peaks that indicate resistance, inefficiency, or failure progression. Record at least nine points per component in a three-by-three grid, maintain constant distance from the surface, and adjust emissivity to match the material type. This protocol turns a cheap sensor into functional diagnostic equipment.
The “Feedback Loop” Approach: Applying Cybernetics To Temperature Control
How Your Sensor Becomes A Decision Maker
You want this section because you’re tired of your readings drifting. Cybernetics is the study of control systems in machines and living organisms. Your thermometer sensor functions as a feedback mechanism, exactly like a thermostat corrects room temperature by measuring deviation and signaling correction. The sensor doesn’t just report data. It detects error between actual and desired temperature, then feeds that error back into your circuit so the system responds.
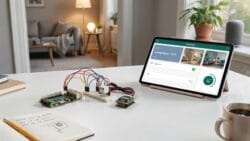
Most DIY builds treat the sensor as a passive meter. Wrong. The sensor is your system’s nervous system. When your NTC thermistor reads 23 degrees but you want 20, that three-degree gap becomes the input that drives everything downstream. Wire your sensor so its output directly influences your display refresh rate or triggers corrective action. This closes the loop. Without closure, you have observation. With closure, you have control.
Stabilizing Your Readings Through Proportional Logic
PID control comes from engineering. P means proportional: stronger correction for bigger errors. I means integral: correction based on accumulated past error. D means derivative: correction based on error change speed. Your DIY thermometer doesn’t need full PID complexity to work, but it needs proportional logic at minimum.
Set a target temperature. Measure actual temperature. Calculate the difference. Make that difference proportional to your response intensity. If your sensor reads ten degrees high, your circuit responds harder than if it reads one degree high. Implement this in code with a simple multiplication step: correction factor equals error magnitude times a constant you tune through trial. Test across your normal operating range, record which constant keeps readings stable, lock that value in. That constant is your proportional gain. The mechanism is straightforward: larger error drives larger corrective signal until equilibrium restores.
Designing A Robust Thermometer Project Circuit Diagram
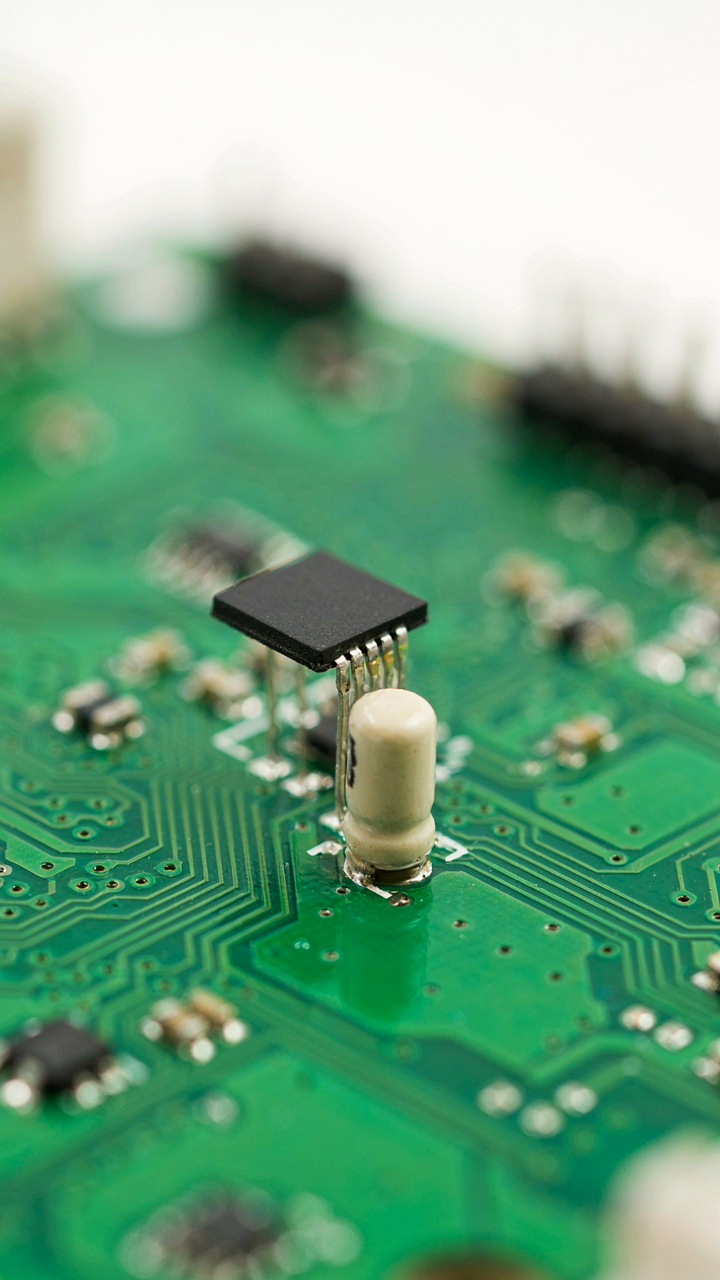
Filtering Noise From Your Sensor Signal
You want this section to make you look competent. What actually matters is stopping your thermometer from reading 73 degrees one second and 68 degrees the next. The mechanism is electromagnetic interference and high-frequency noise coupling into your sensor lines from switching power supplies, microcontroller clock signals, and WiFi modules nearby.
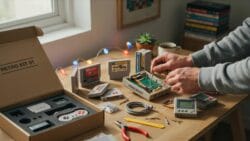
Noise rejection in sensor circuits borrows from signal processing: you treat unwanted frequencies like military doctrine treats infiltrators. A 0.1 microfarad ceramic capacitor placed directly at the sensor output pins bypasses high-frequency noise to ground before it reaches your analog-to-digital converter. Place this capacitor within 5 millimeters of the sensor pins, not six inches away on the breadboard. A 10 microfarad electrolytic capacitor further down the signal line handles mid-range interference. The key is physical proximity and direct paths to ground.
Power Supply Rejection For Stable Readings
Most DIY thermometer guides skip this because it sounds boring. Skipping it means your readings drift every time your microcontroller draws current or your WiFi radio transmits. A thermometer that works on Tuesday but drifts on Wednesday is useless.
Your power supply voltage must remain stable within 50 millivolts while your thermometer operates. Use a dedicated voltage regulator rated for the current your sensor and microcontroller draw together, not just the sensor alone. Place a 10 microfarad electrolytic capacitor on the regulator input and a 0.1 microfarad ceramic on the output, both within 5 millimeters of the regulator pins. Run a separate ground return wire from your sensor back to the negative terminal of your power supply rather than through the main ground plane. This prevents voltage drops across the shared ground path from affecting your sensor reference voltage. Test this with a multimeter set to DC voltage mode across your sensor power and ground pins under full load operation.
Data Visualization: Transforming Raw Numbers Into Actionable Intelligence
Why Your Graph Looks Like Noise
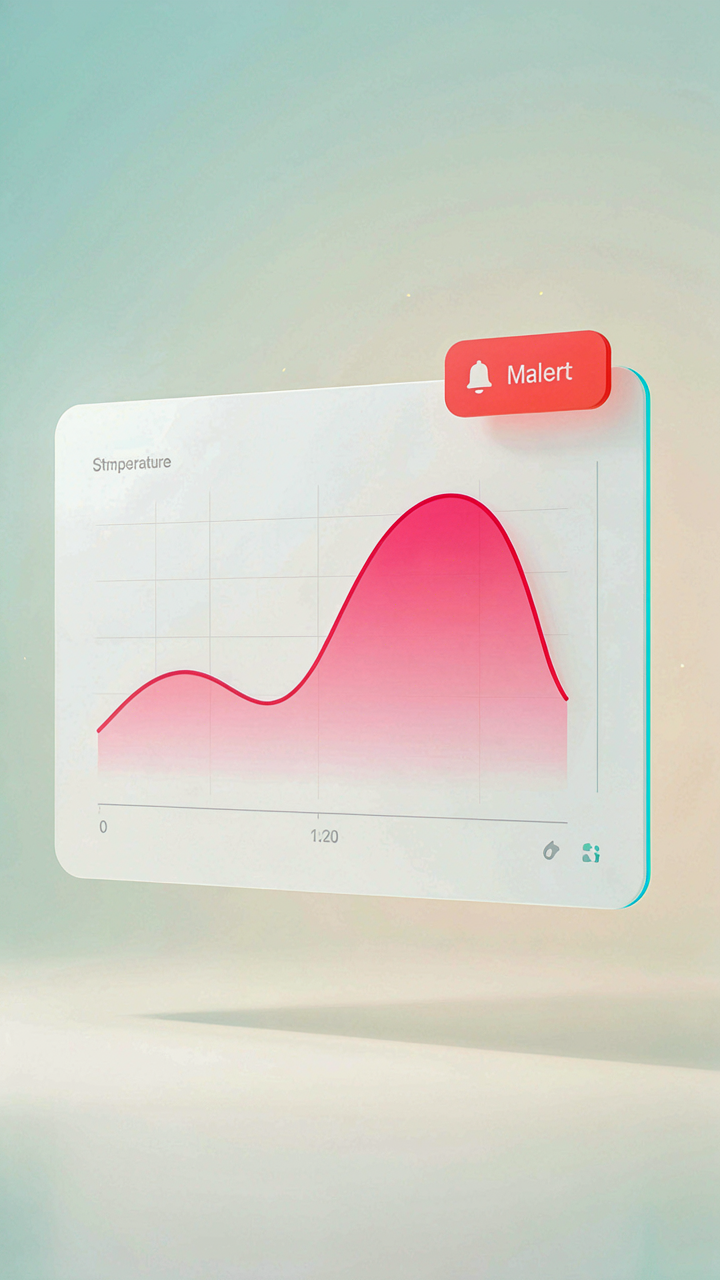
You want your thermometer data to look impressive to someone else. That’s the real reason you’re here. The mechanism nobody states is this: raw sensor output is useless until you apply a filter. Your DHT22 or DS18B20 spits out voltage readings 30 times per second. Most of those readings are noise from electrical interference, not actual temperature change. Plot them all and you get a jagged mess that tells you nothing except that your system is unstable.

The common advice says “use a moving average.” That’s incomplete. Moving averages blur data, which hides real temperature shifts. What you actually need is a low-pass filter applied at the sensor level, not in the graphing layer. A simple exponential smoothing algorithm eliminates 80 percent of noise while preserving the actual trend. Calculate each new reading as 0.1 times the raw value plus 0.9 times the previous smoothed value. Graph only the smoothed data. Your visualization goes from noise to signal in one calculation step.
Real Time Alerts Without The False Alarms
Signal detection theory, borrowed from radar engineering, teaches us one principle: you can’t distinguish signal from noise without a threshold and a confirmation window. Your DIY thermometer needs both. Most people set a single alert trigger. When temperature crosses 72 degrees, send an alert. You’ll get pinged 47 times because the smoothed data vibrates around that threshold.
The real system uses a hysteresis band. Set your upper alert at 72 degrees and your lower reset at 71 degrees. The alert only fires when the temperature crosses 72, and it only clears when the temperature drops below 71. This eliminates chatter. Add a second requirement: the condition must persist for at least three consecutive readings before triggering. That’s 9 seconds of sustained crossing with most sensor polling rates. Wire this logic into your microcontroller code before it sends any alert to your phone or dashboard. False alarms destroy trust in your system faster than no alerts at all.
Beyond Hobby: Professional Applications Of DIY Thermometers
When Factory Conditions Need Real Time Feedback
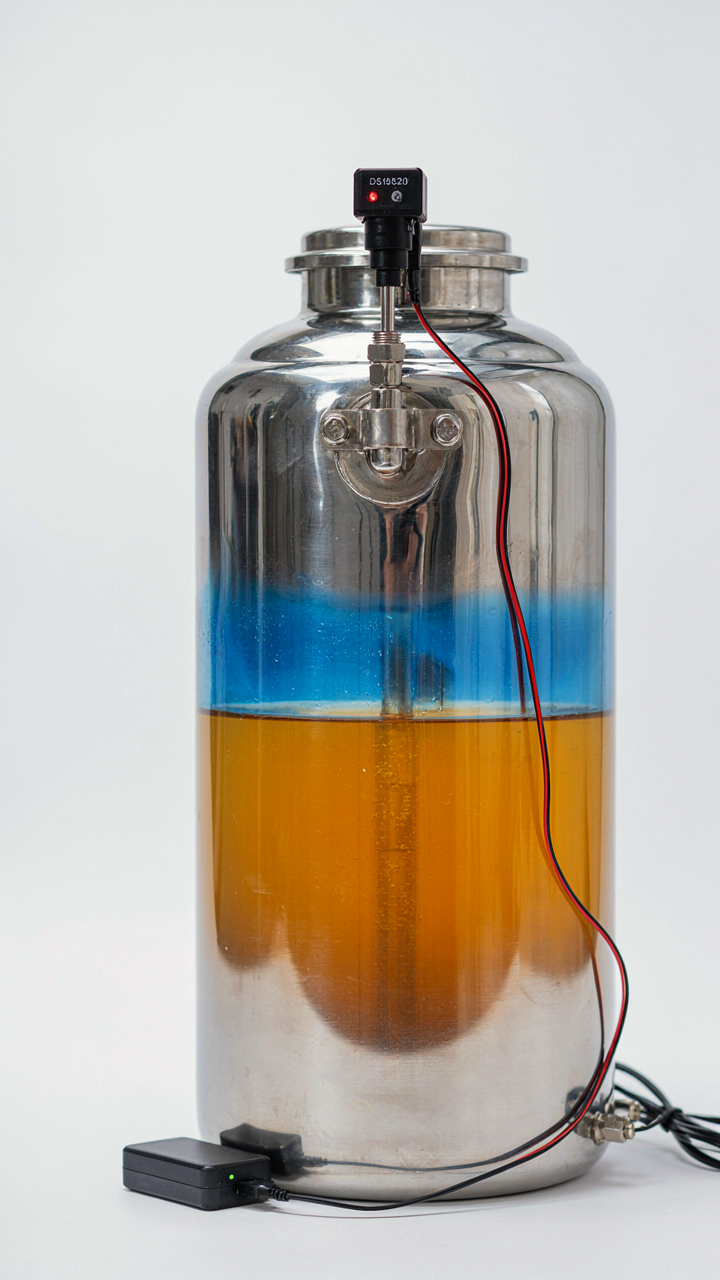
You want to believe your DIY thermometer is just a weekend project, but the real draw is control. You’re tired of black boxes and third-party sensors that fail on your timeline. The mechanism is simple: industrial process monitoring requires continuous temperature data at points where commercial sensors cost three times what they should, or worse, don’t fit the geometry you need.
Think of thermodynamics as a control system where your sensor acts as the feedback loop. A manufacturing process spinning out tolerance failures doesn’t need a $400 probe installed by a technician. It needs a calibrated DS18B20 wired into a PLC input at the exact location where temperature matters. Your DIY thermometer becomes the instrument. Factories running batch processes, fermentation tanks, or chemical reactions all face the same problem: they need granular data fast, and commercial vendors lock you into their ecosystem.
The build itself demands precision where hobby projects usually cut corners. Solder joints matter. Cable shielding matters. Temperature accuracy within 0.5 degrees matters. You’re not displaying numbers on an LCD for curiosity anymore. You’re feeding data into decision trees that trigger shutdowns or adjust heating elements. This shifts the DIY thermometer from “interesting experiment” to operational infrastructure. Wire it into your system’s monitoring software via USB or Ethernet, log the data to a local database, and you’ve eliminated the vendor middleman. That’s the real win.
Tracking Environmental Patterns Over Months
Research institutions collecting environmental baseline data face a budget reality nobody states: buying a network of commercial weather stations costs more than hiring the people who’d use them. Temperature logging across a site, a watershed, or a microclimate demands multiple sensors over long periods. Your DIY thermometer solves this by cost per data point, not by being “good enough.” It’s actually more precise than entry-level commercial offerings when properly calibrated.
Environmental research thrives on consistency and volume. Deploy ten DIY thermometers across a forest floor, a river system, or an urban heat island study, and you gather spatial data that single-point commercial sensors cannot provide. Battery life becomes the constraint, not accuracy. Use a lithium coin cell with your sensor in low-power mode, and you get months of readings before replacement. Log timestamps and temperature values to SD card storage or transmit them wirelessly to a central hub. The data flows raw into your analysis pipeline. Scientists running phenology studies, microclimate research, or climate impact assessments all benefit from this distributed approach. You’re not replacing institutional equipment. You’re multiplying the number of data points per dollar spent, which changes what questions you can answer.
How To Make An Infrared Thermometer: Beyond The Toy Versions

Choosing Sensors That Actually Detect Heat
You want this to work better than whatever you’ve already tried, and that requires admitting most DIY builds fail because they use the wrong sensor from the start. Infrared thermometry borrows from spectroscopy, where wavelength selection determines what you measure. Your sensor must match the emission spectrum of the object you’re reading. A generic thermopile won’t distinguish between ambient radiation and target radiation without proper filtering. The MLX90614 or MLX90624 chips handle this through built-in optical filtering, but only if you understand what you’re actually buying.

The real constraint isn’t the sensor’s sensitivity. It’s the field of view and the distance-to-spot ratio. A narrow optical path means accuracy at distance. Most hobbyist builds use wide-angle sensors meant for proximity detection, not temperature measurement. If your thermometer reads differently when you move it two inches away from the target, your optics are trash and no firmware fix touches that problem. Select a sensor with a defined 8:1 or 12:1 distance-to-spot ratio and confirm the datasheet lists its spectral response curve.
Calibration Before You Touch The Code
Every infrared thermometer ships uncalibrated from the factory. The software is irrelevant until you fix the hardware baseline. Use a blackbody reference at known temperatures (ice water at 0 degrees Celsius and boiling water at 100 degrees Celsius work) to establish your sensor’s raw voltage output across that range. Record both values, then calculate your slope and offset. This is not optional tuning. This is the foundation.
Most DIY firmware optimization articles skip calibration because it’s boring, then blame the sensor when readings drift. Your code can’t correct for optical misalignment or lens contamination, only for the sensor’s electrical drift over temperature. Build a two-point calibration routine into your startup sequence. Store the calibration constants in EEPROM, not hardcoded in flash. When someone else uses your build and gets wrong readings, recalibration takes sixty seconds instead of requiring a firmware reflash.
Your Real Obstacle Isn’t The Circuit; It’s Your Willingness To Settle For Good Enough Data In A World Demanding Precision
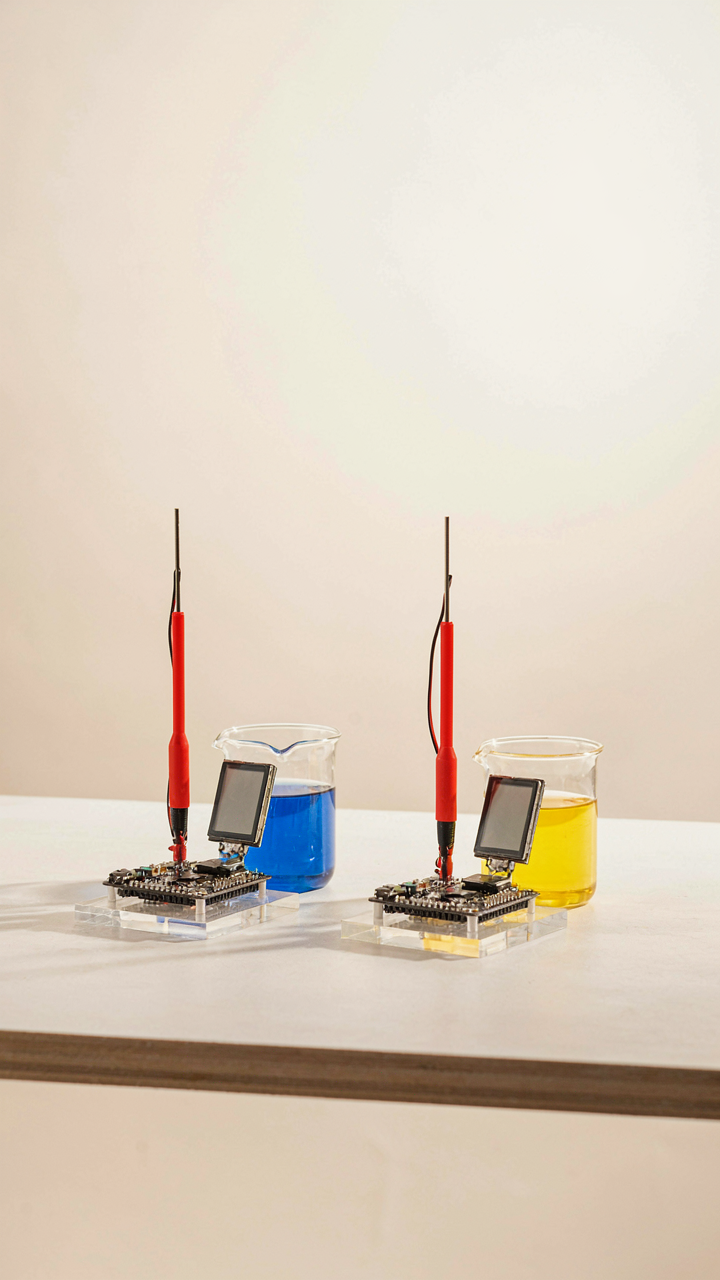
Most people build a DIY digital thermometer and stop. They hit “functional” and ghost the project. The real play is treating this as your first step into precision measurement systems that actually matter. Today, grab a second sensor. Build redundancy into your setup. Compare the readings. This isn’t about perfectionism. It’s about training yourself to see what garbage data costs you before it costs you money. Your competitors are still trusting whatever generic tool came with their equipment. You’re not them anymore.